The Remaking: Traffic Intersection Troubles

Course: UT 230 Data and Urban Inquiry

Professor: Elisa Ngan

Date: Winter 2023

Group Members: Dylan Shefman

Role: Prototyper Lead

Tools: Figma, Illustrator, VSCode, Python, Photoshop

Skills:

Illustrator

Python

Networks

Code →

In the intricacies of urban life, city systems weave a complex web of interconnected elements. From the bustling streets and towering skyscrapers to the intricate networks of transportation and communication, cities embody a dynamic and multifaceted ecosystem. Navigating the labyrinth of urban complexity requires an understanding of how various components seamlessly interact, shaping the vibrant heartbeat of modern urban areas.

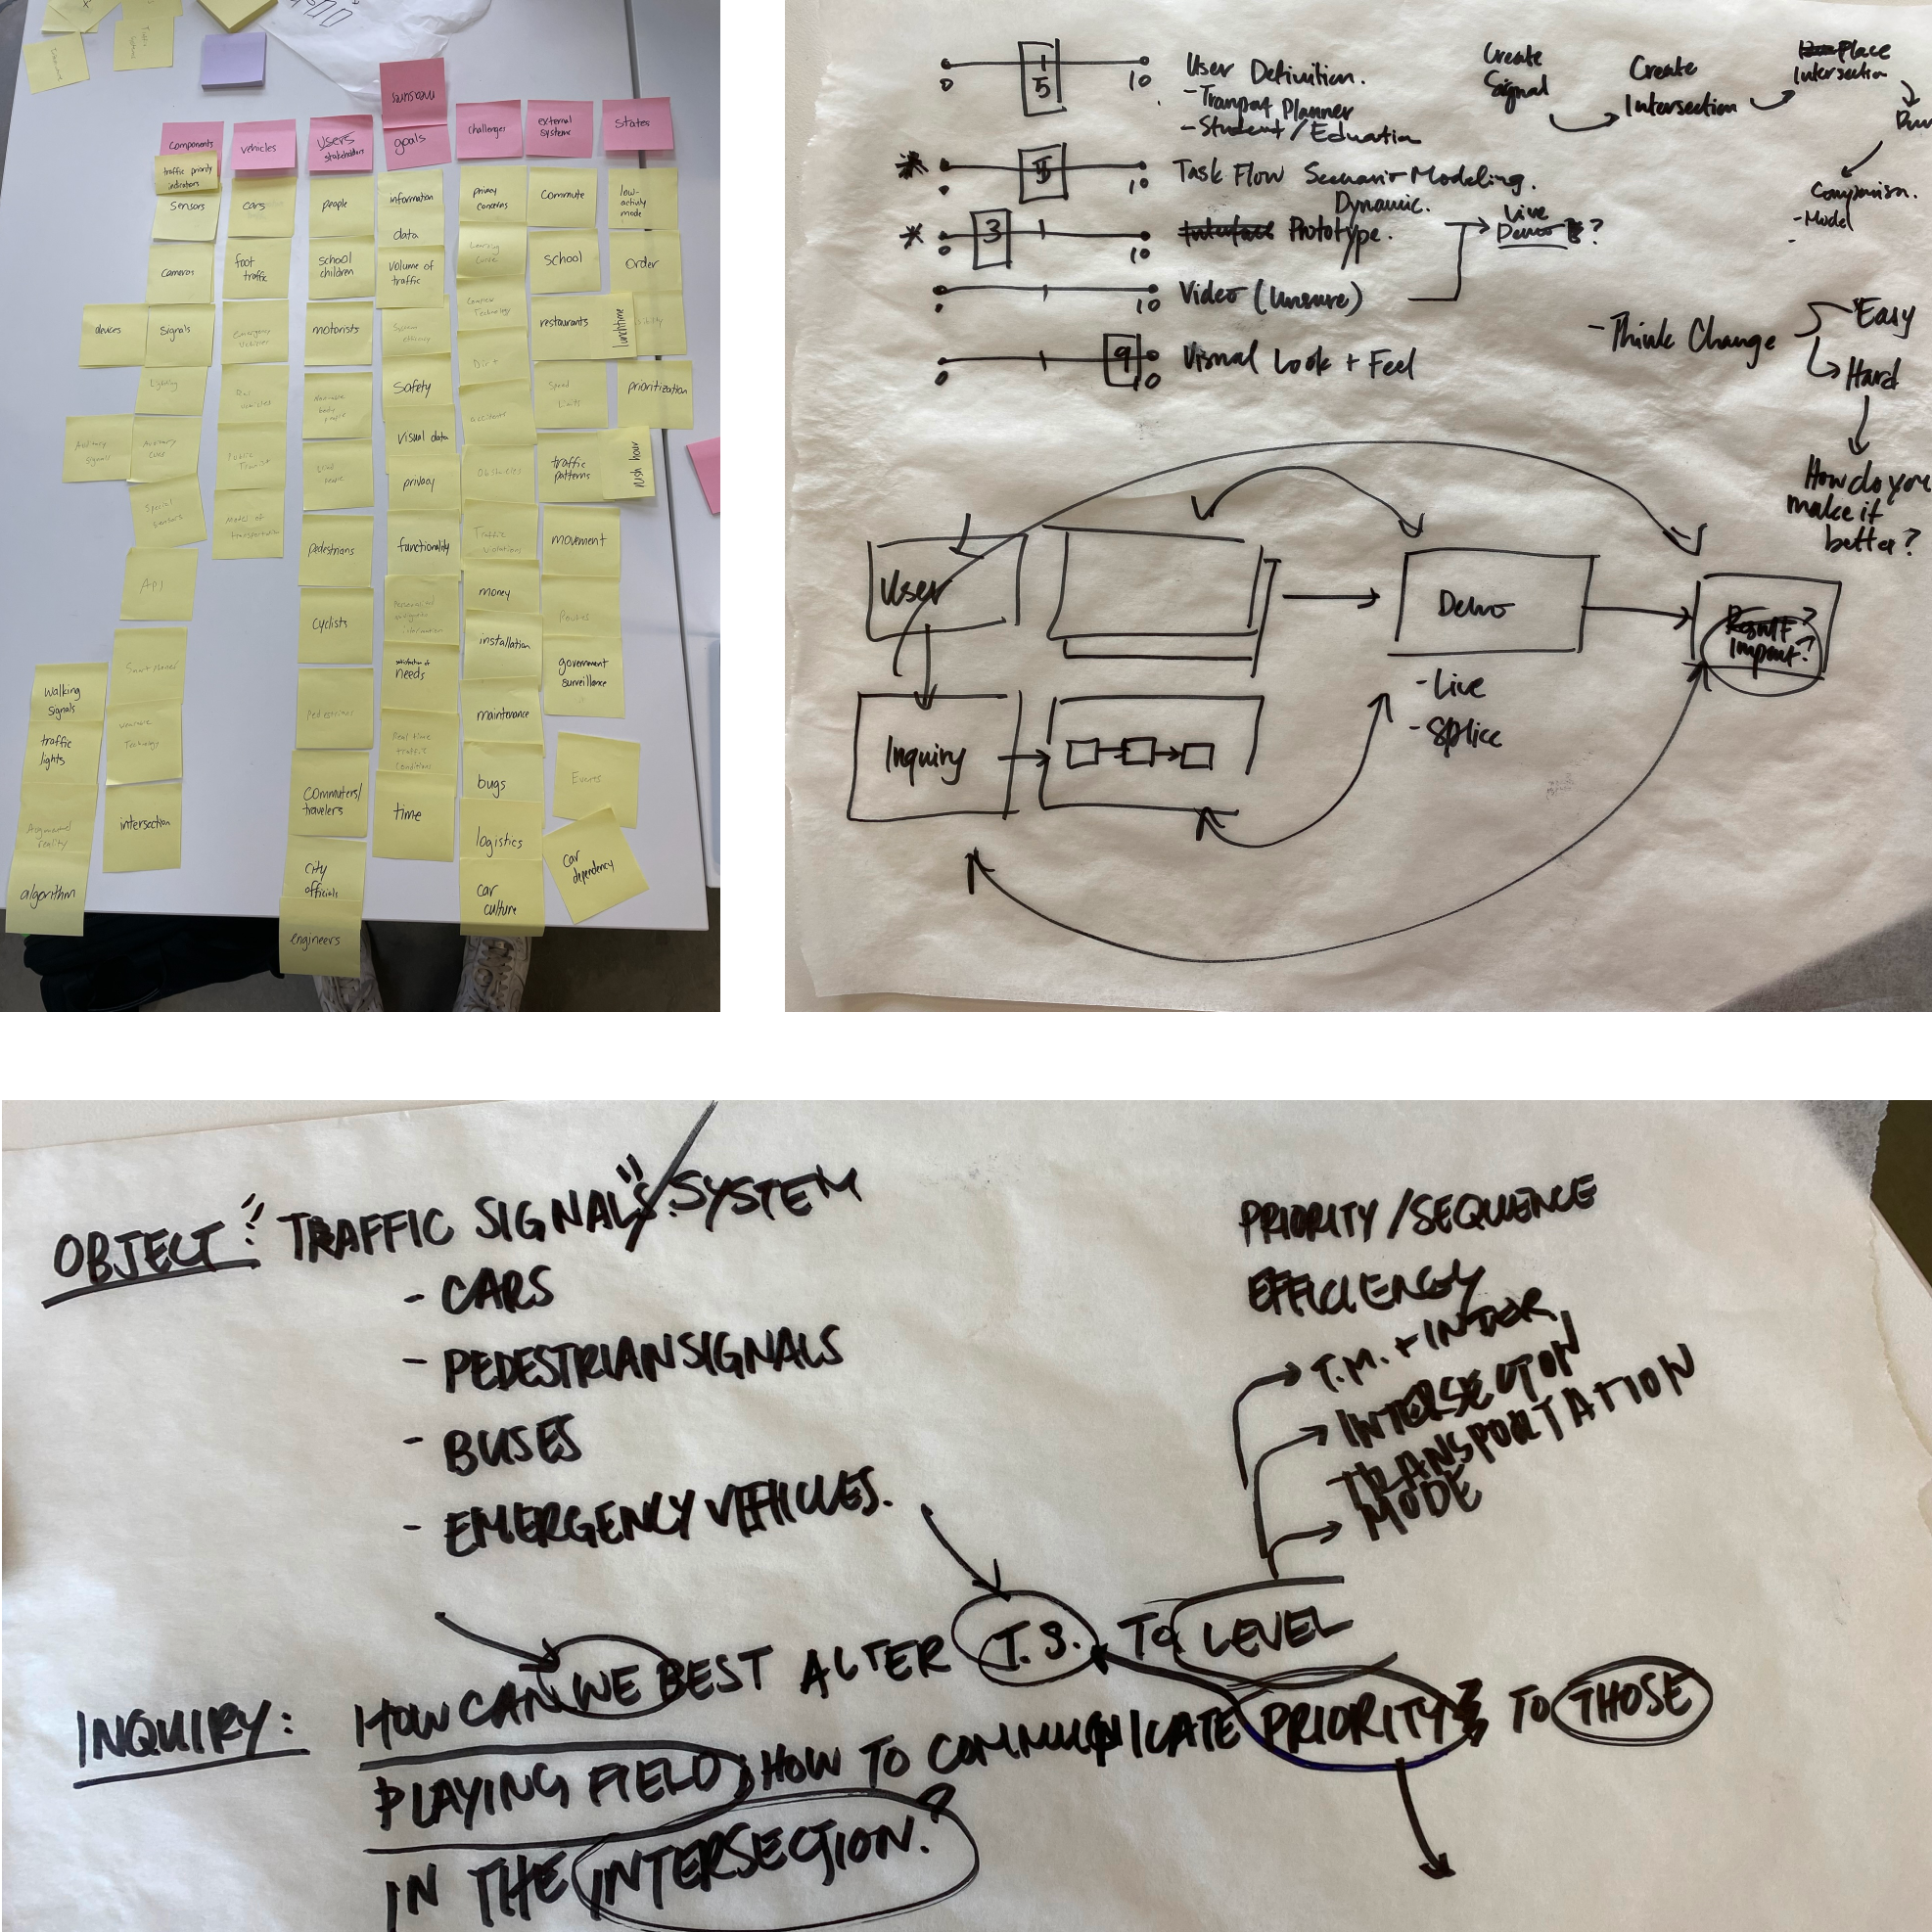
To fully comprehend the inner works of a city, planners use interactive and through tools to understand their surroundings and test their ideas. However, for the average citizen, these tools can be just as complex as the city system itself, making it challenging for them to participate in ongoing developments right in their backyard.

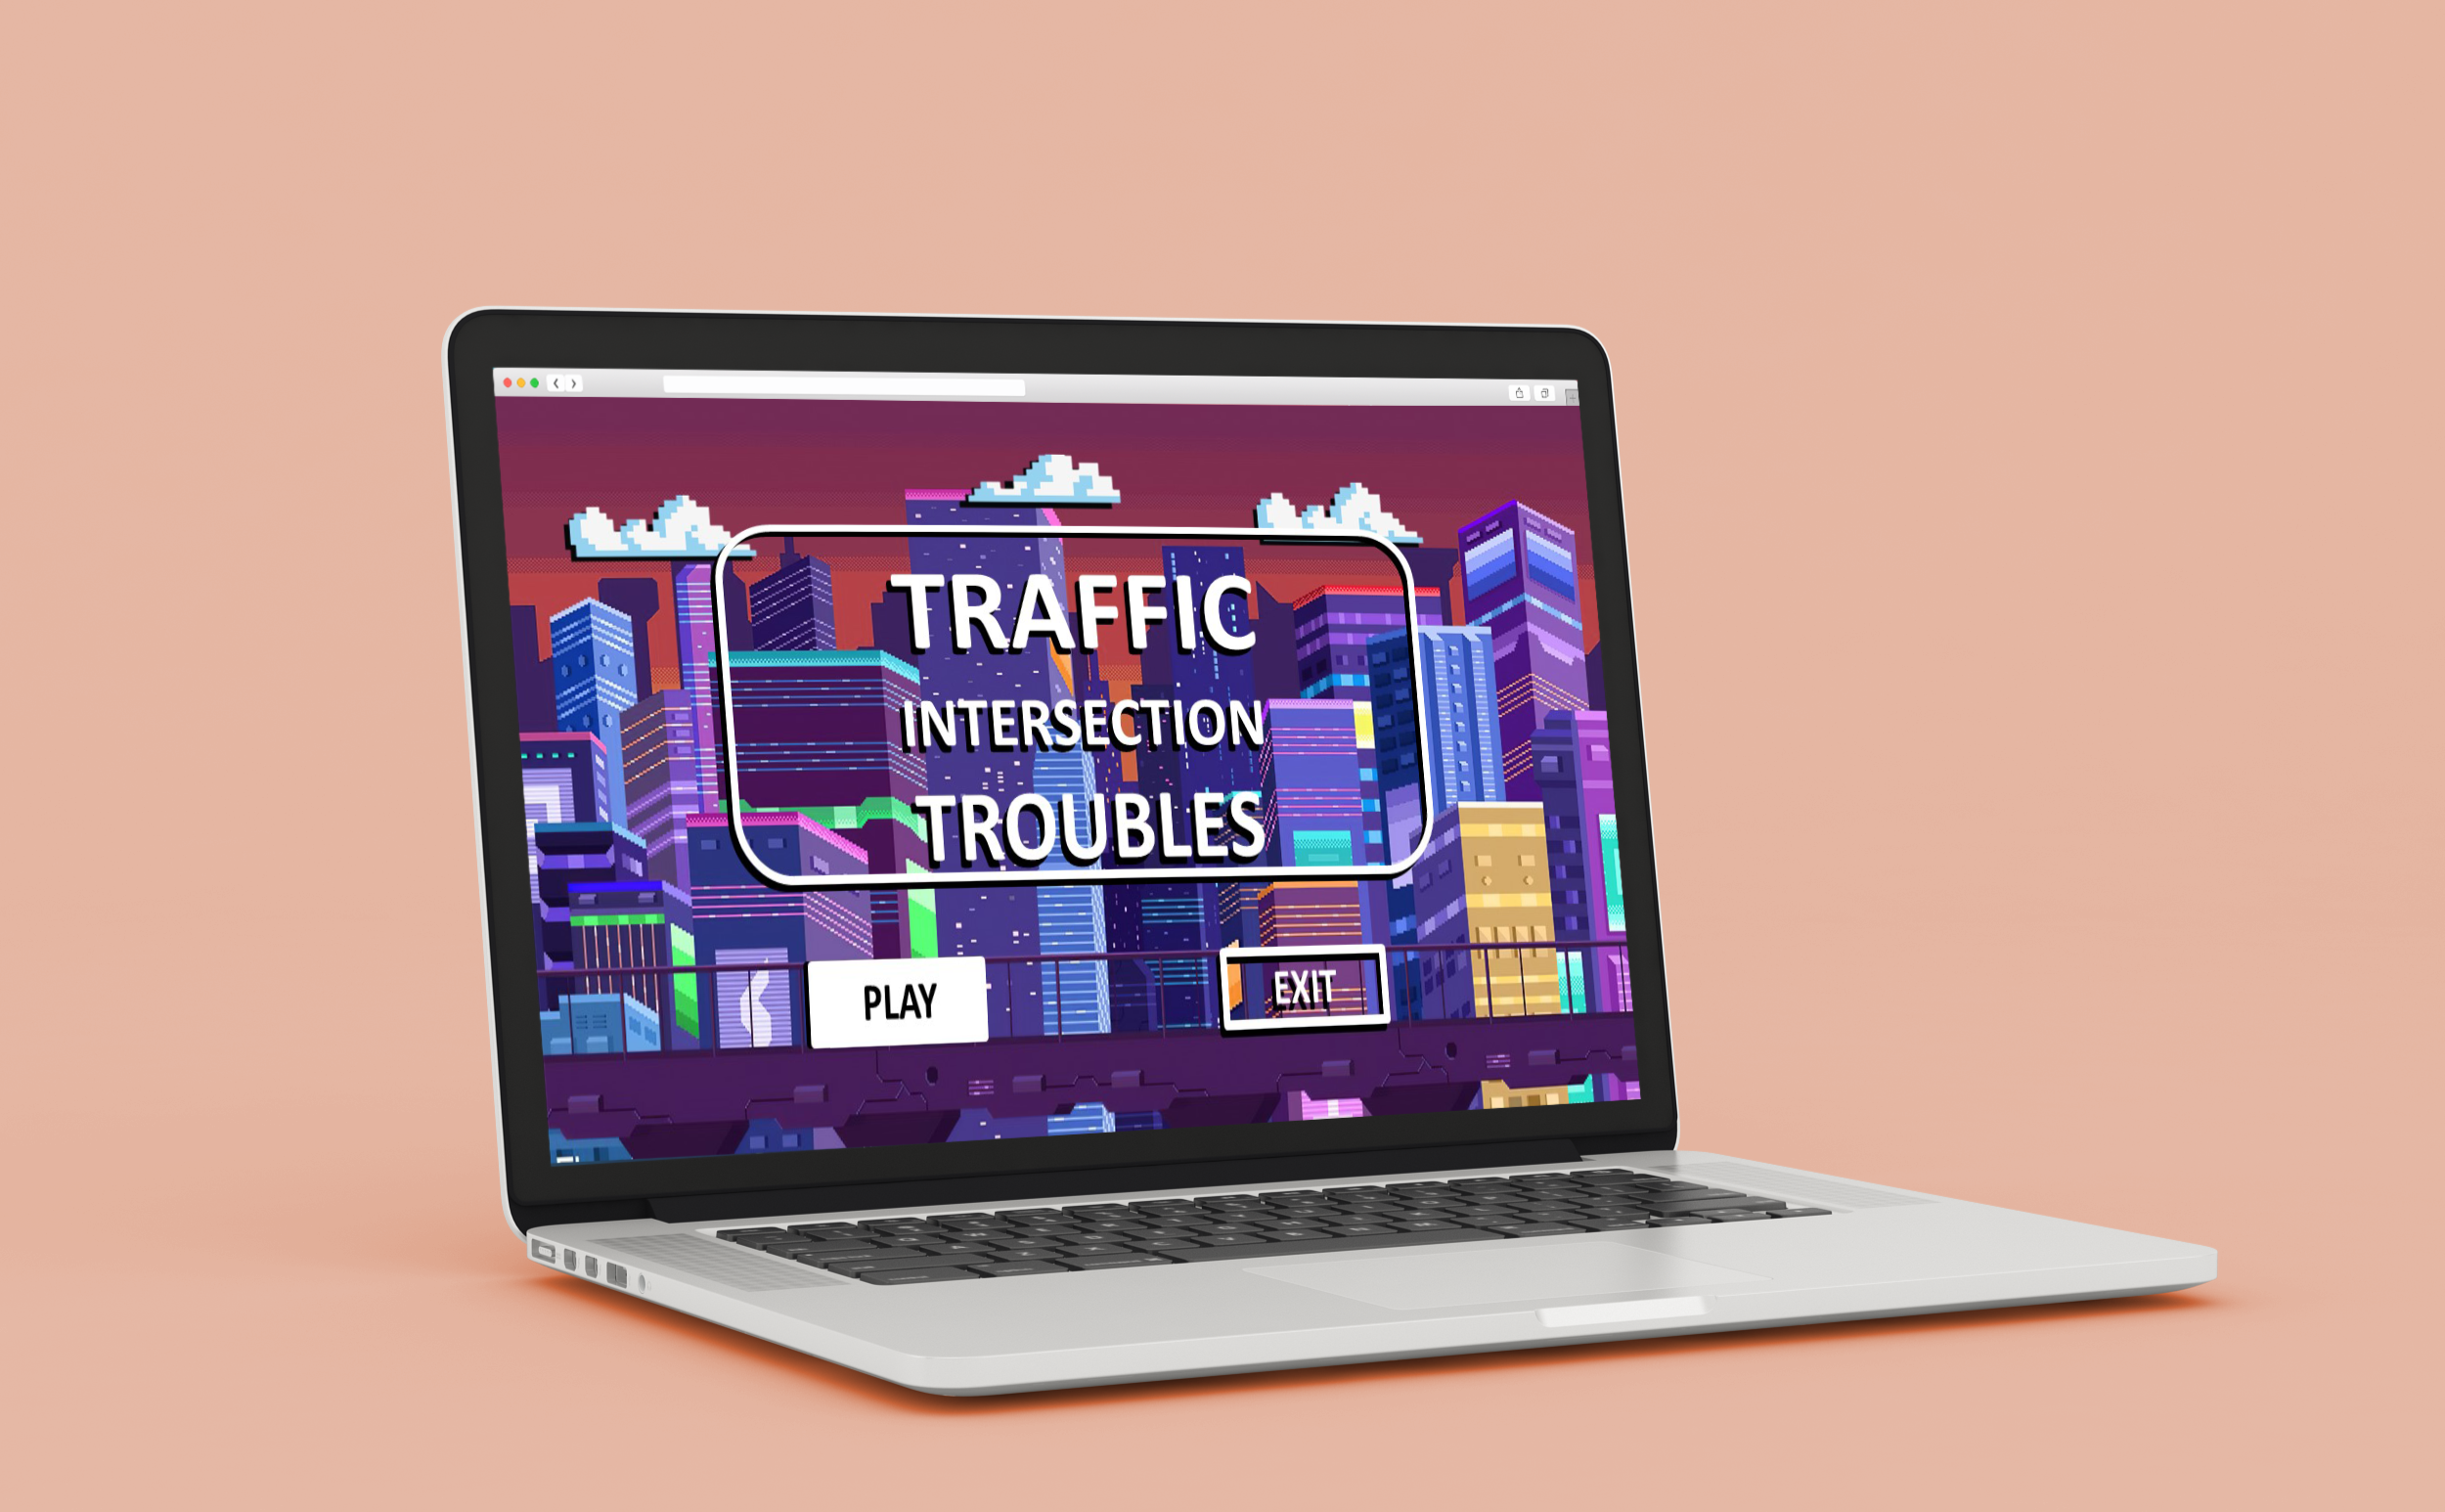
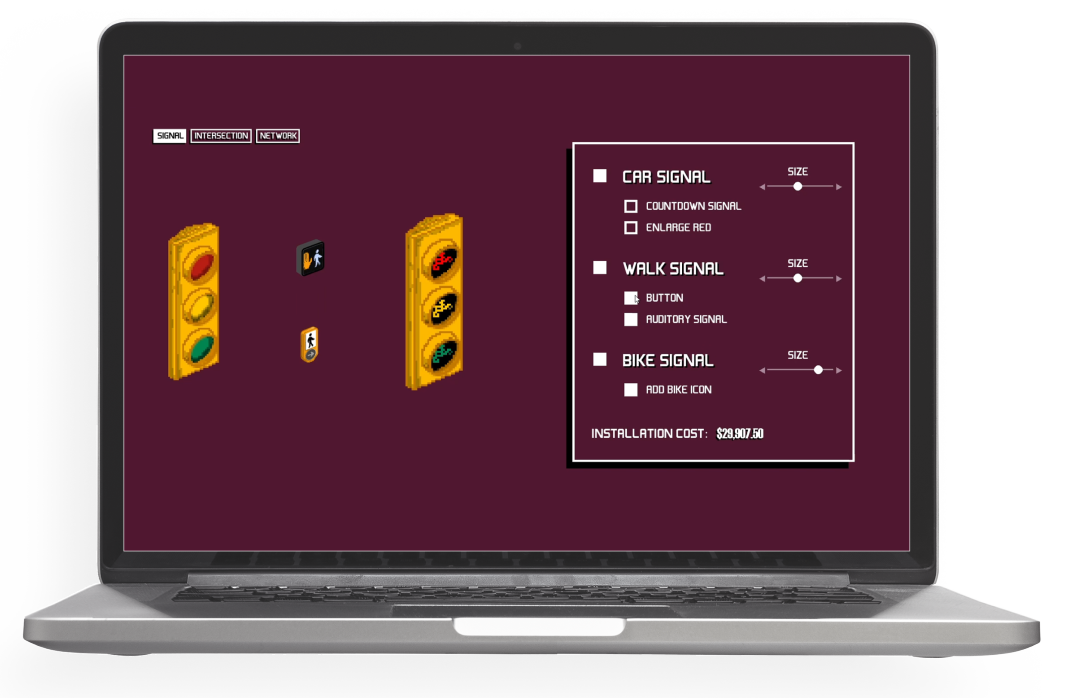
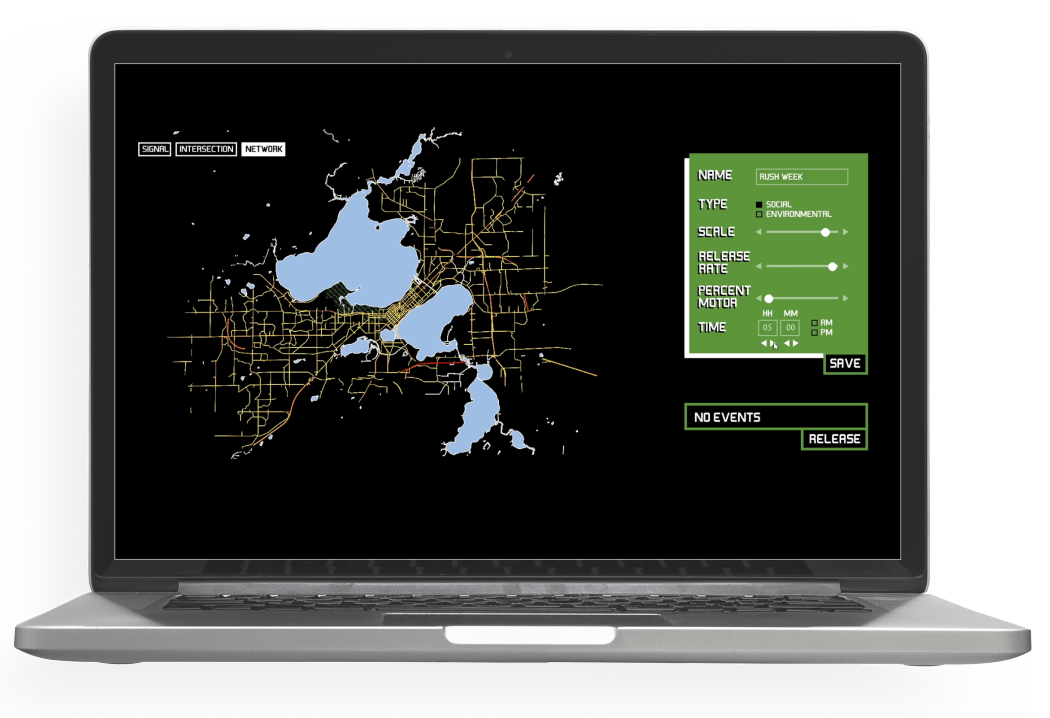
Our goal for this project was to create a tool where both citizens and planners can utilize to develop and test their own ideas, seeing real-time what effect they could have on the city.

To focus our project, we created the following “How might we…” question:

HMW: How can we make a tool to help make city planning decisions that is both interactive and user friendly?

Network Focus

For our project, we chose to focus on road networks. We thought road networks would be both fun and informative to model since they are the converging point where other city systems connect to - i.e public transport, city services, logistics and supply chain, and public events. Its centrality acts as the backbone, as a faulty road layout can cause a city and its environment to decline.

Also, a quick glance at my other projects would show that I have an absorbing fascination with road layouts and urban planning. Dylan Shefman, my partner for this project, also shares a similar passion for the project, so we both enjoyed the topic and creation.

These are some of our planning sketches and papers. The sticky notes are all the systems we wanted to include and the trace paper was our inital thoughts on how to design the backend of the game

But Why A Game?

Our main goal was education first, so we chose a game as our medium because we felt like learning about city systems is best through interacting with them. Using game mechanics as our foundation allowed us to create an interactive and customizable experience in a unique way.

So What Does Each Interface Do?

Our game is split up into three different interfaces: Micro, Mezzo, Macro

Micro - Signal

This interface section allows users to create and edit the characteristics of intersection parts such as the traffic lights, pedestrian signals, and crosswalk buttons. As the user changes the settings, a cost calculation is updated and shown at the bottom that correlates with a score. This gets users to perform cost analysis on the different parts by trying to maximize their score.

Mezzo - Intersection

This interface section allows users to create and edit the characteristics of intersection parts such as the traffic lights, pedestrian signals, and crosswalk buttons. As the user changes the settings, a cost calculation is updated and shown at the bottom that correlates with a score. This gets users to perform cost analysis on the different parts by trying to maximize their score.

Users also have the ability to save previous intersections to improve the comparability feature of the game

Macro - Intersection

This interface section is where the user can use the intersections by spot replacing certain road layout nodes. They can then test the new road layout by releasing different types of events, ranging from heavy pedestrians to road closures.

To measure success, statistical values are generated at each time step and are saved to a csv file. Once the user ends their session, the csv file will save and output the information. The following stats includes:

  • Peak percent of max capacity roads
  • Average time for road congestion to normalize
  • Average Commute time